


API Seals

Mechanical Seals

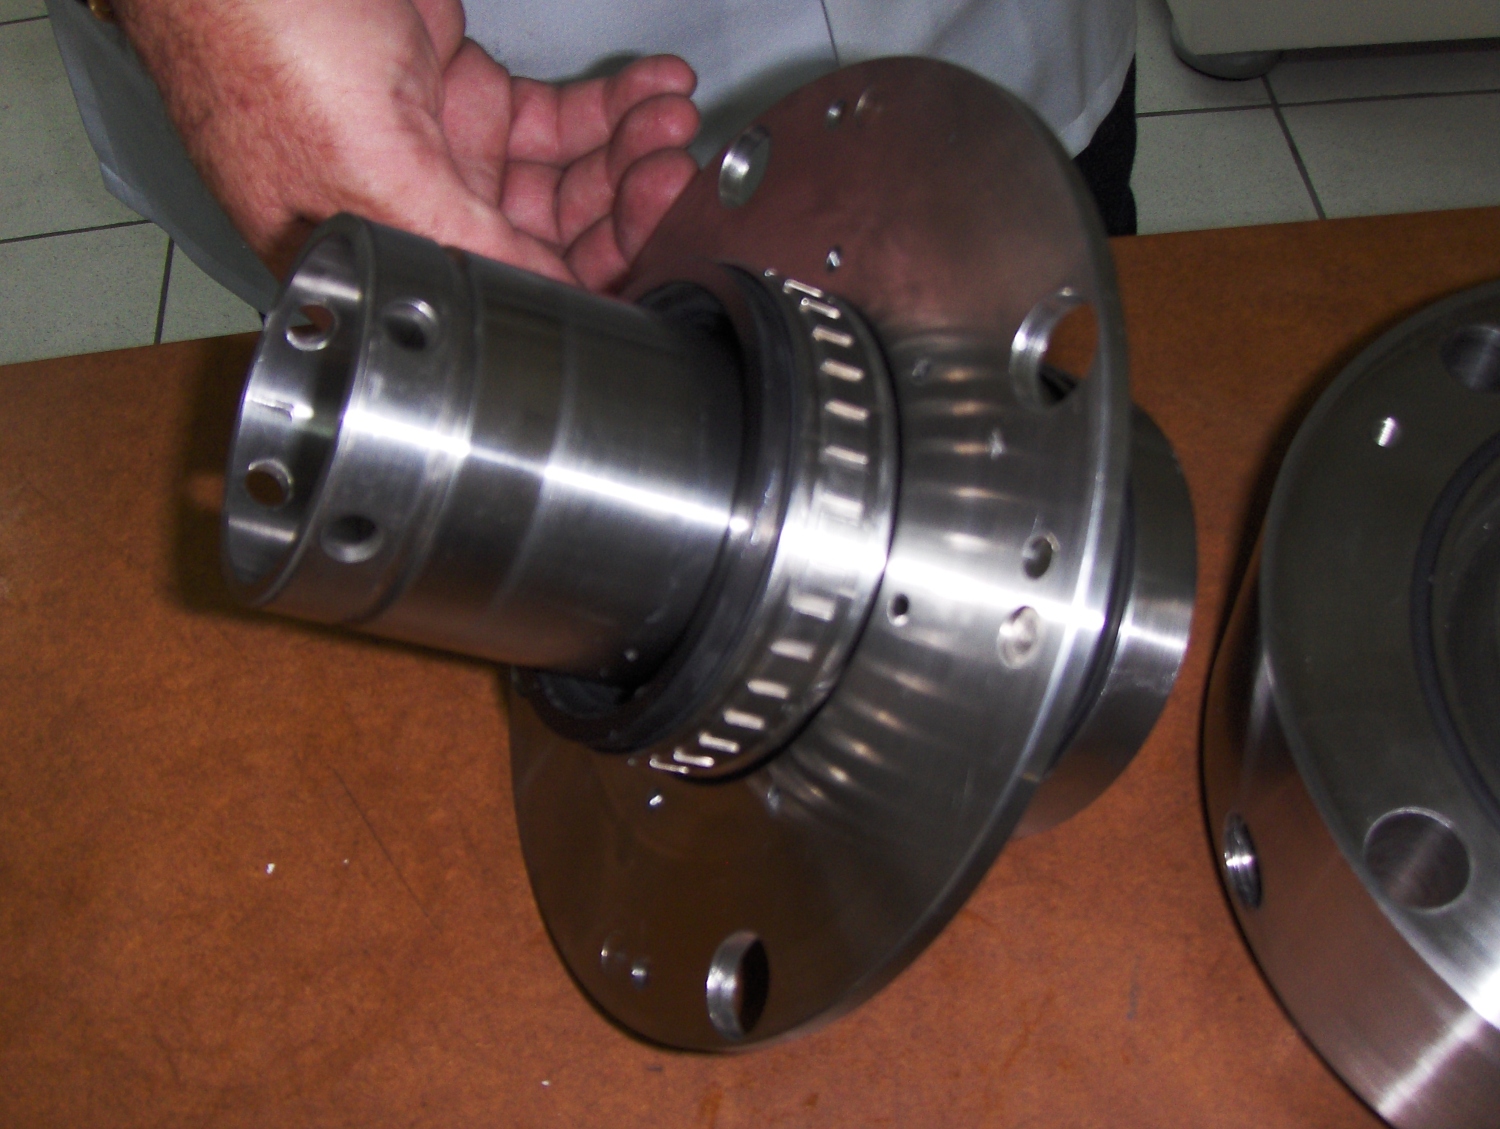
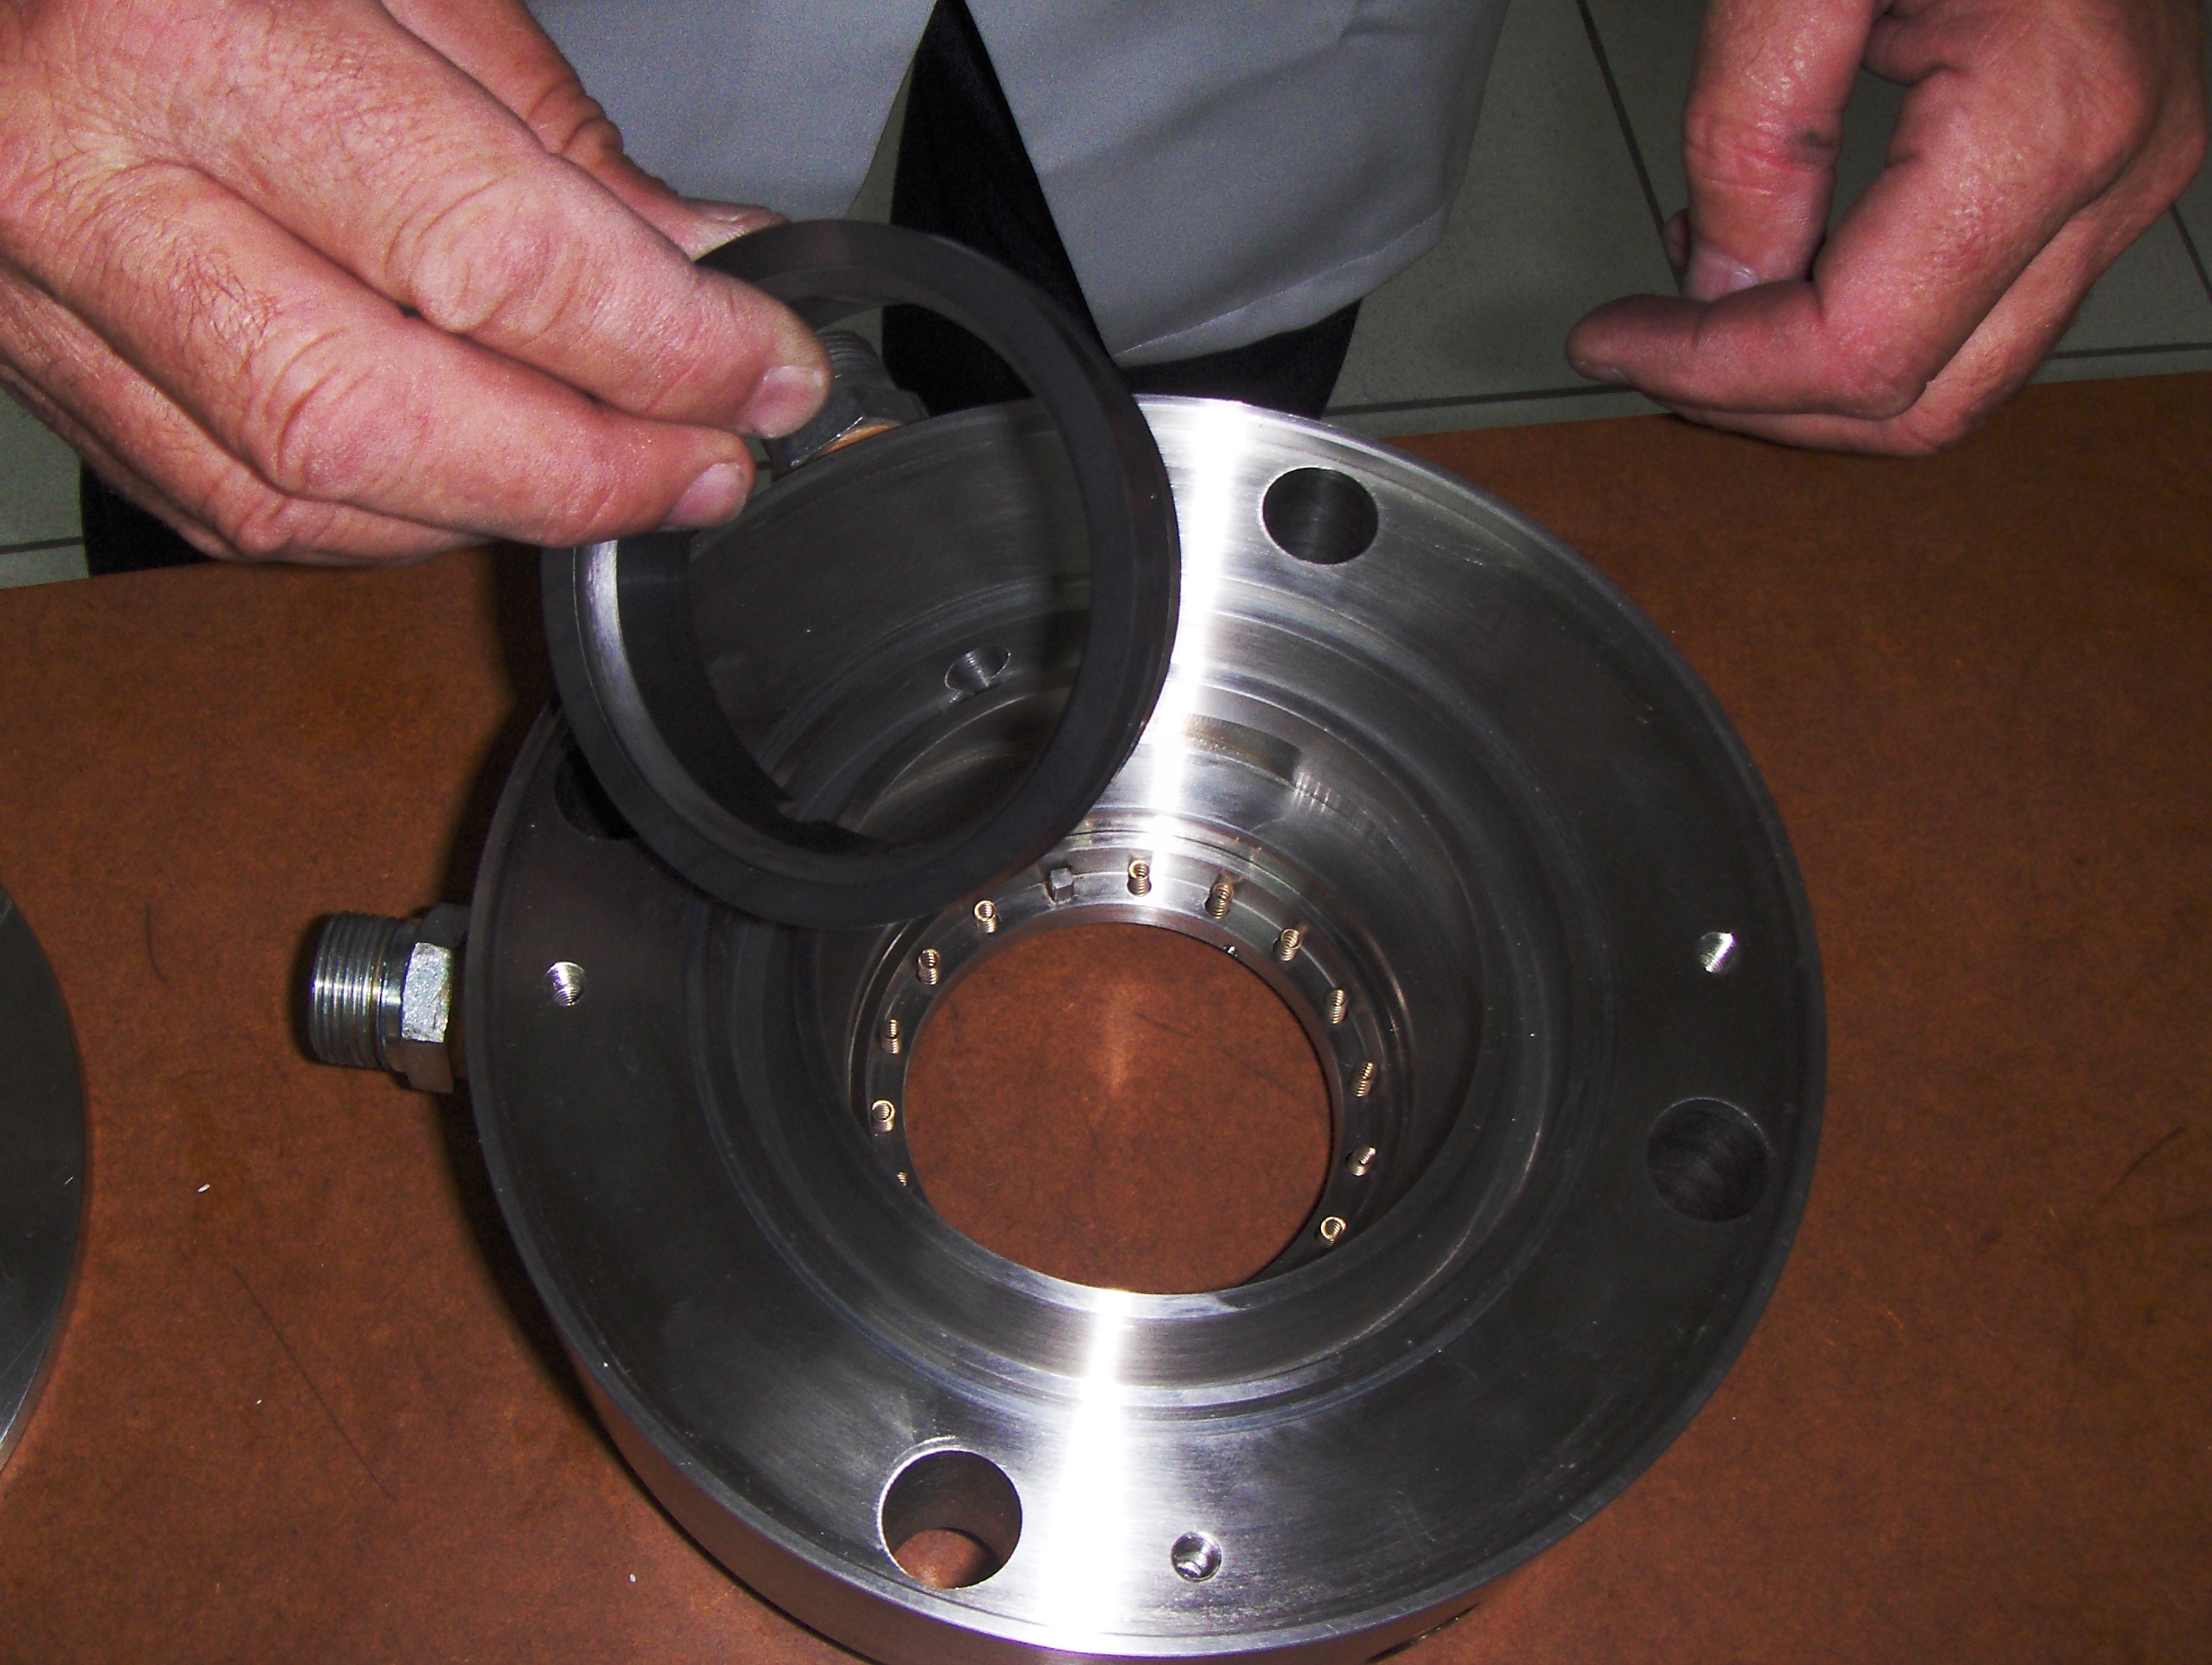
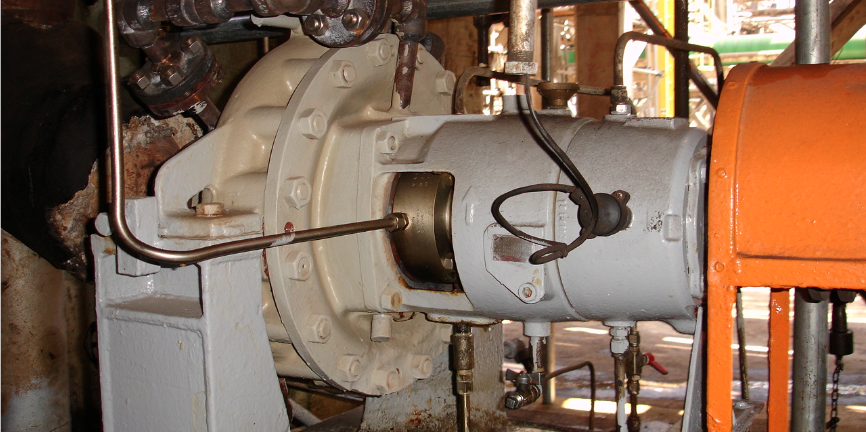
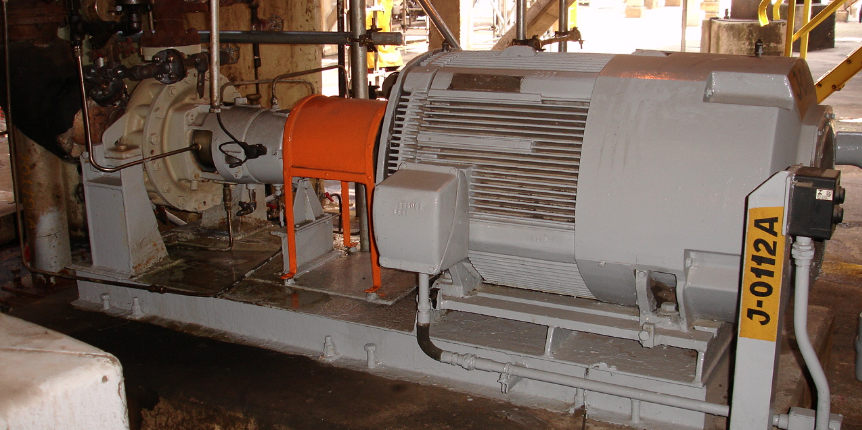
With the support of Petrobras’ supply area, Malavazi developed an API mechanical seal with 100% national technology, approved for manufacturing in accordance with API 682.


API Mechanical Seal Development


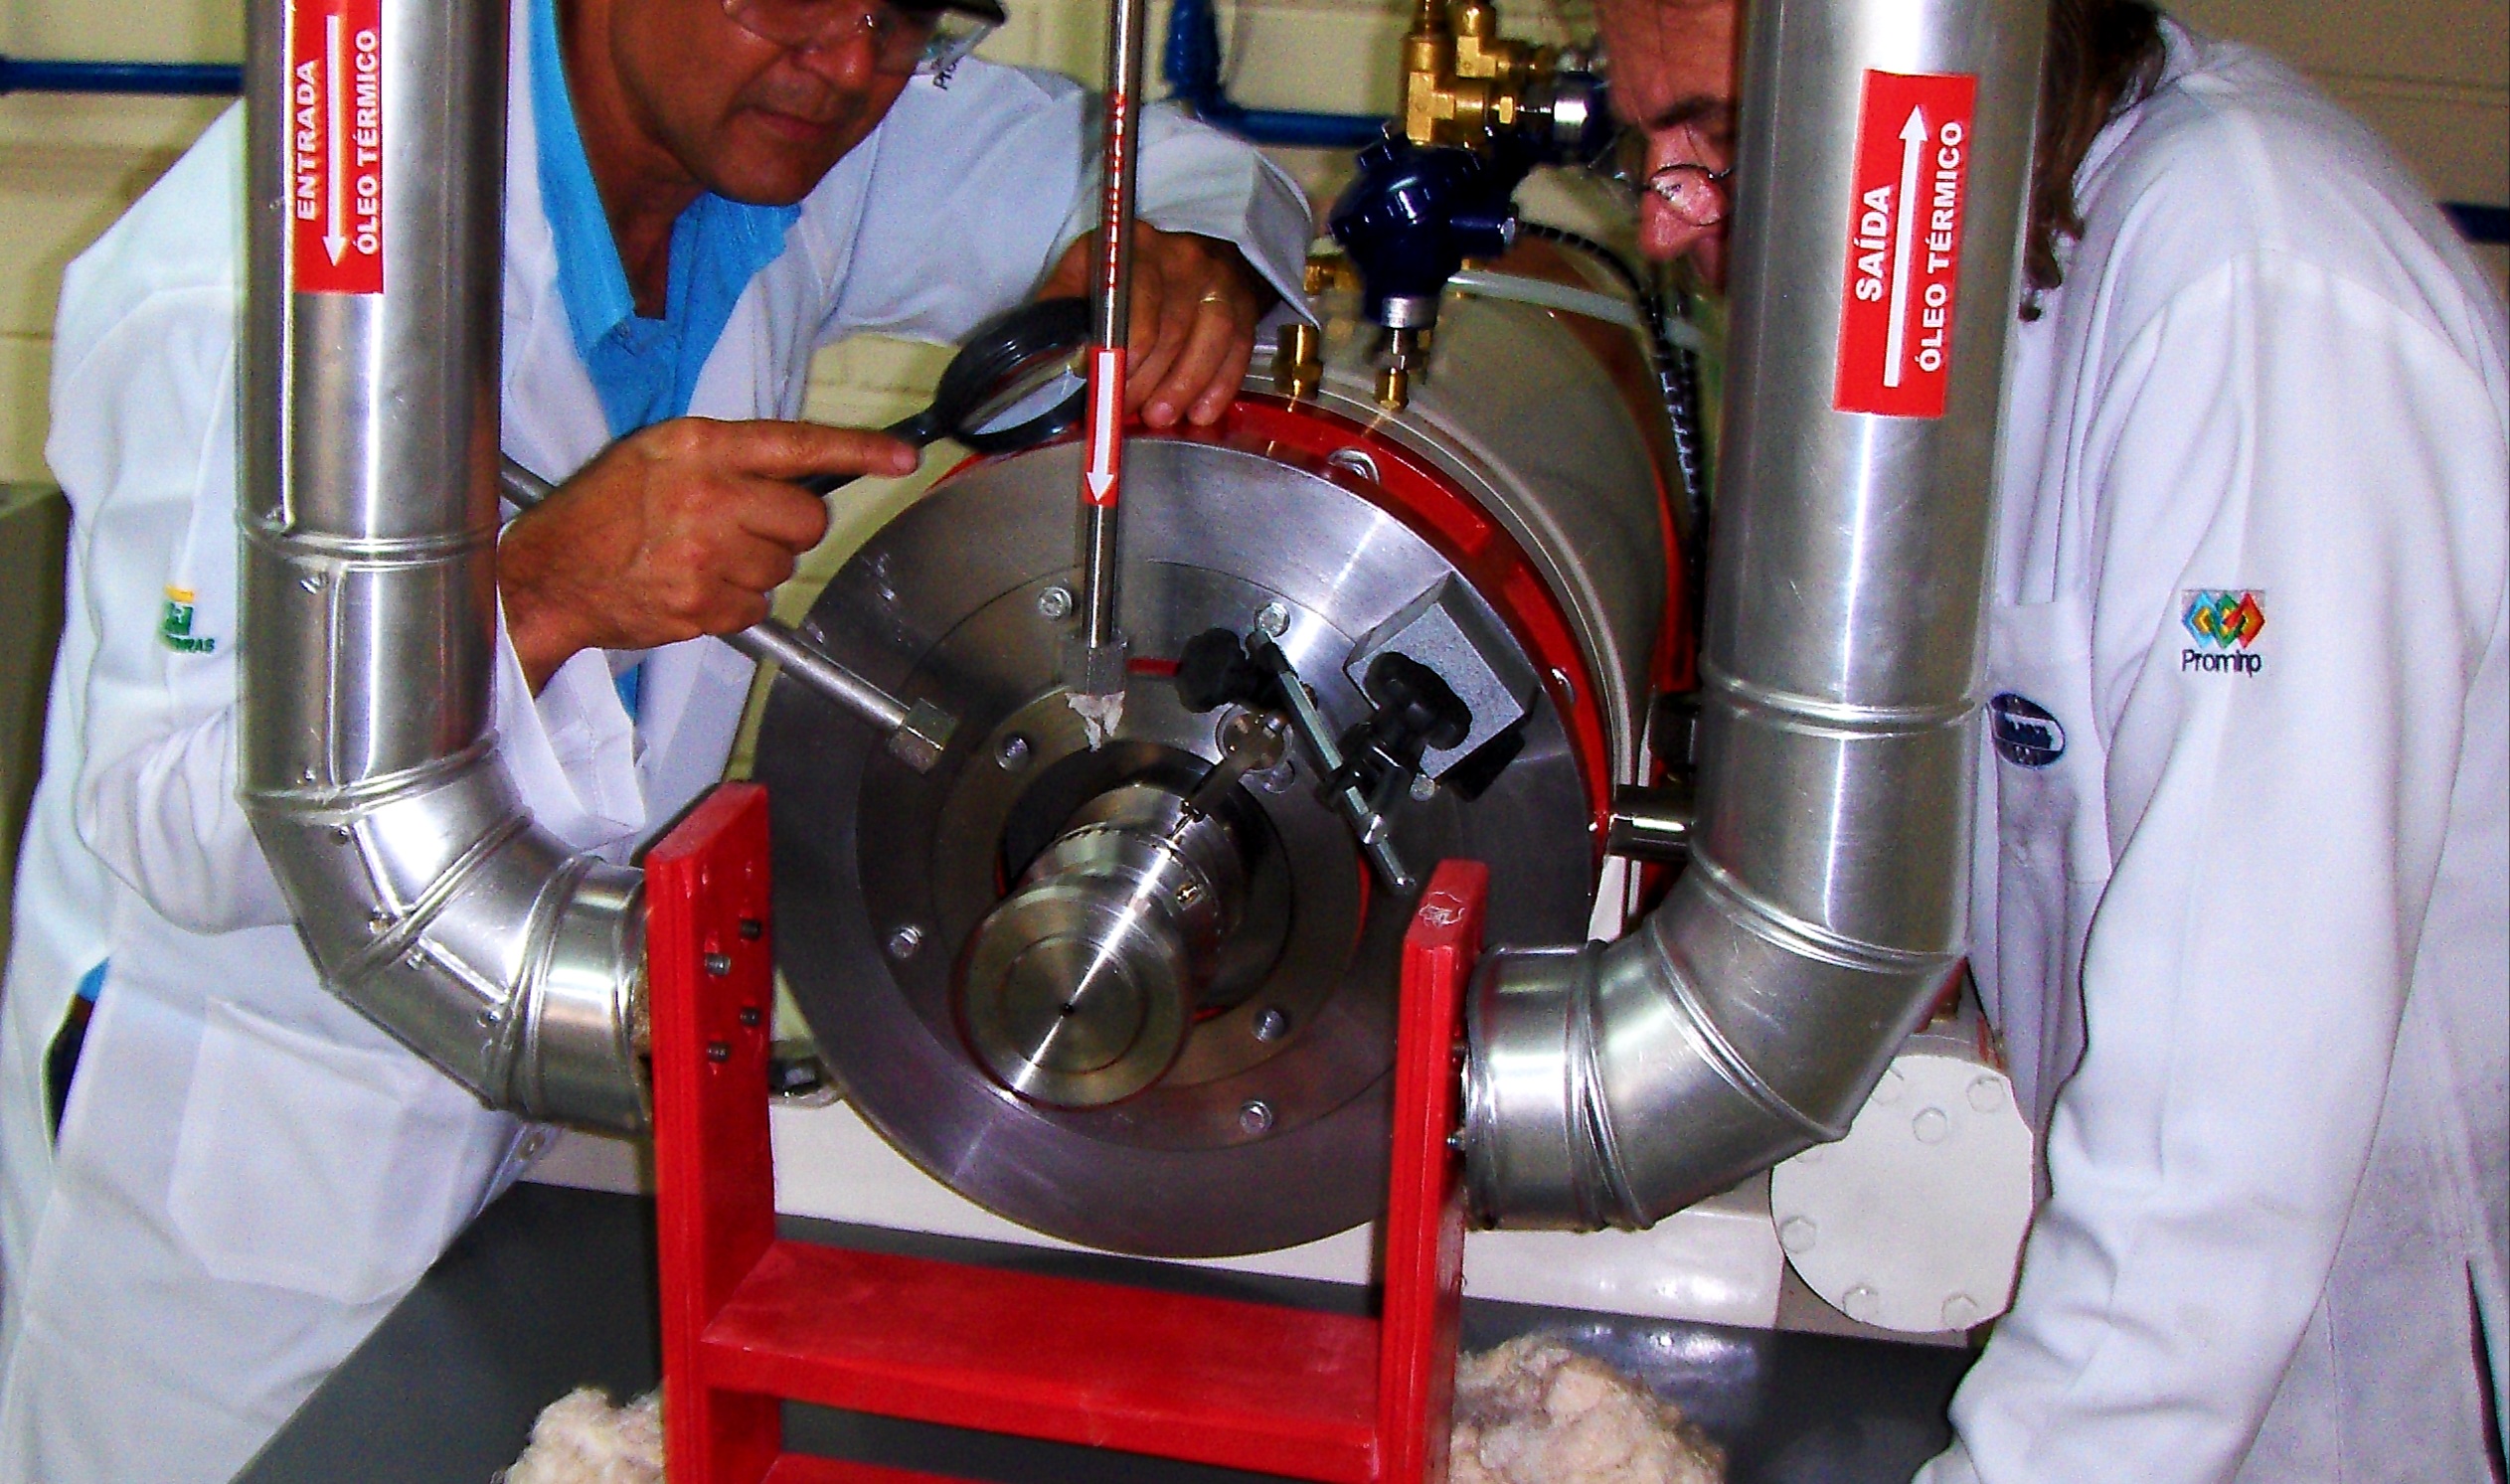
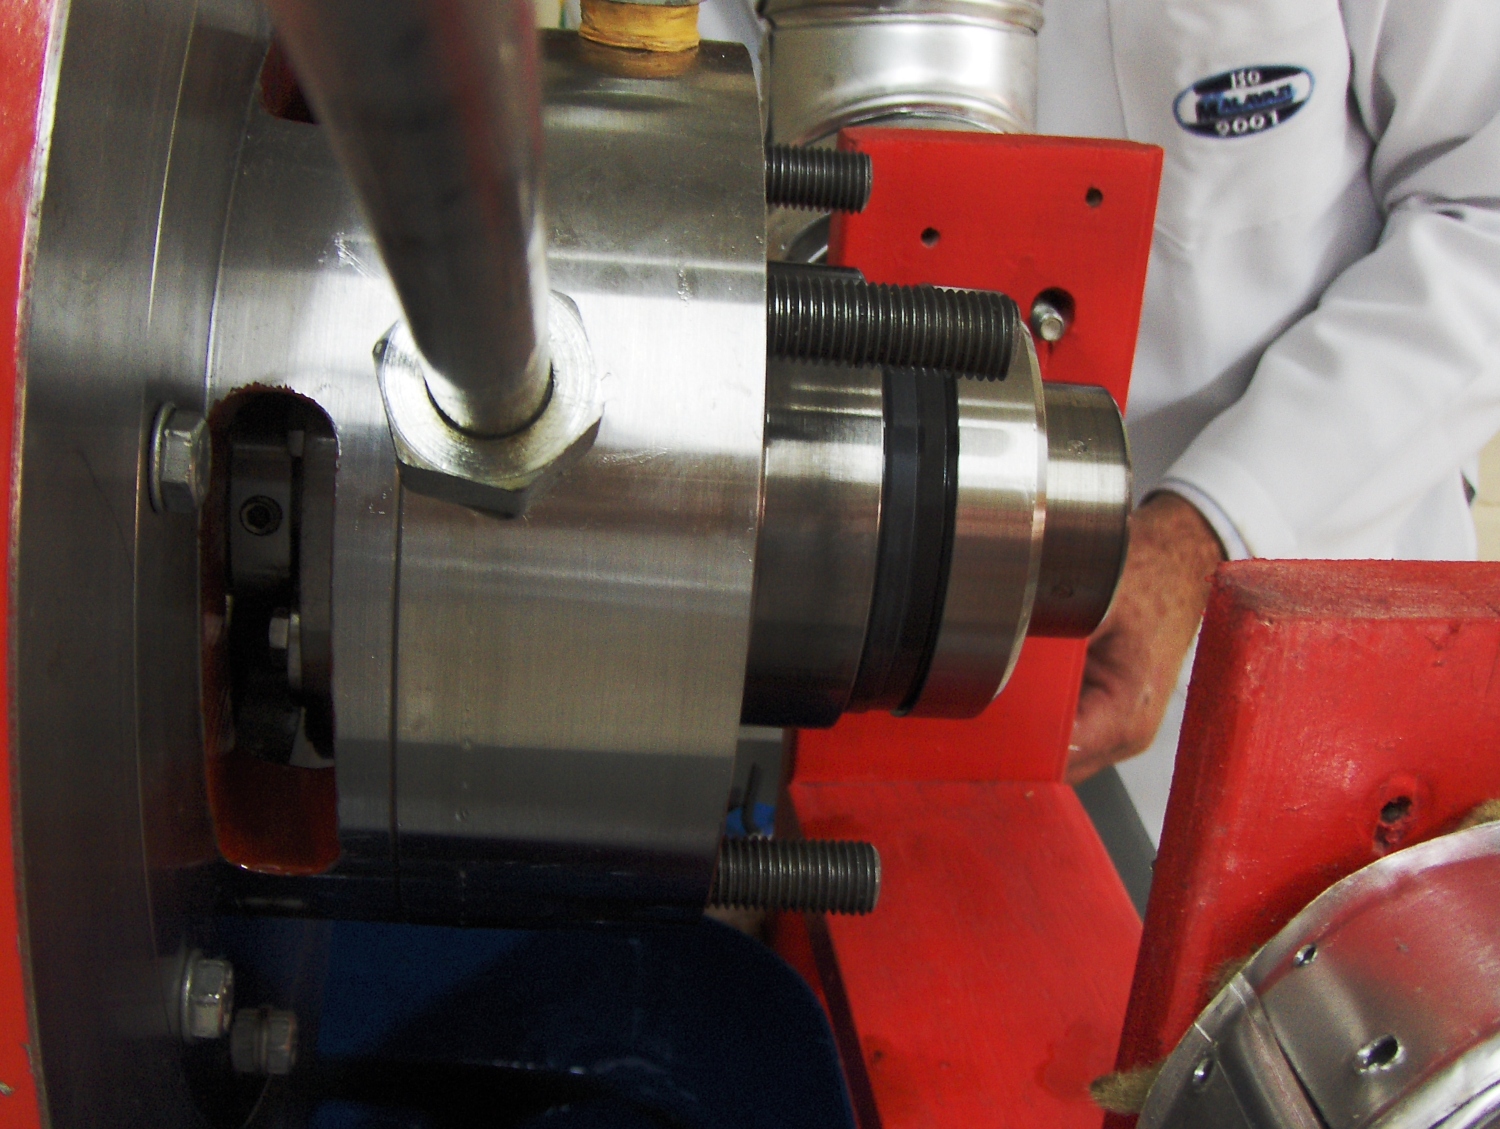
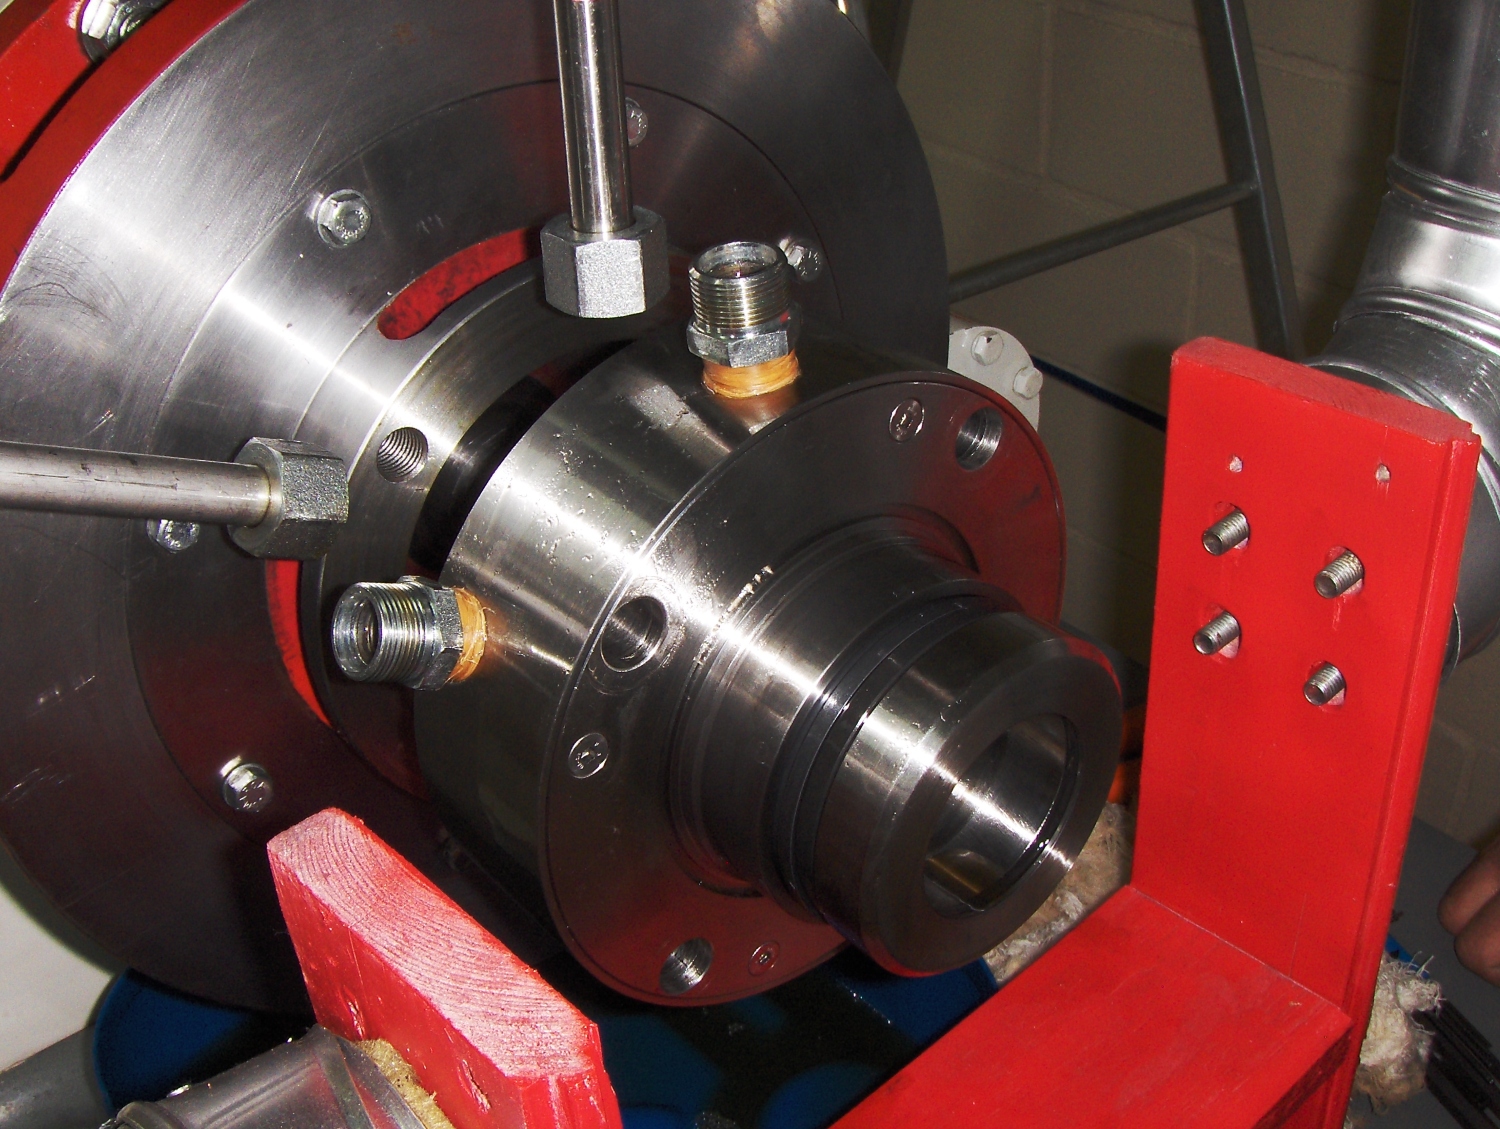
The development of the API mechanical seal was supported by a dedicated engineering structure, including prototype manufacturing, laboratory validations, and controlled testing.
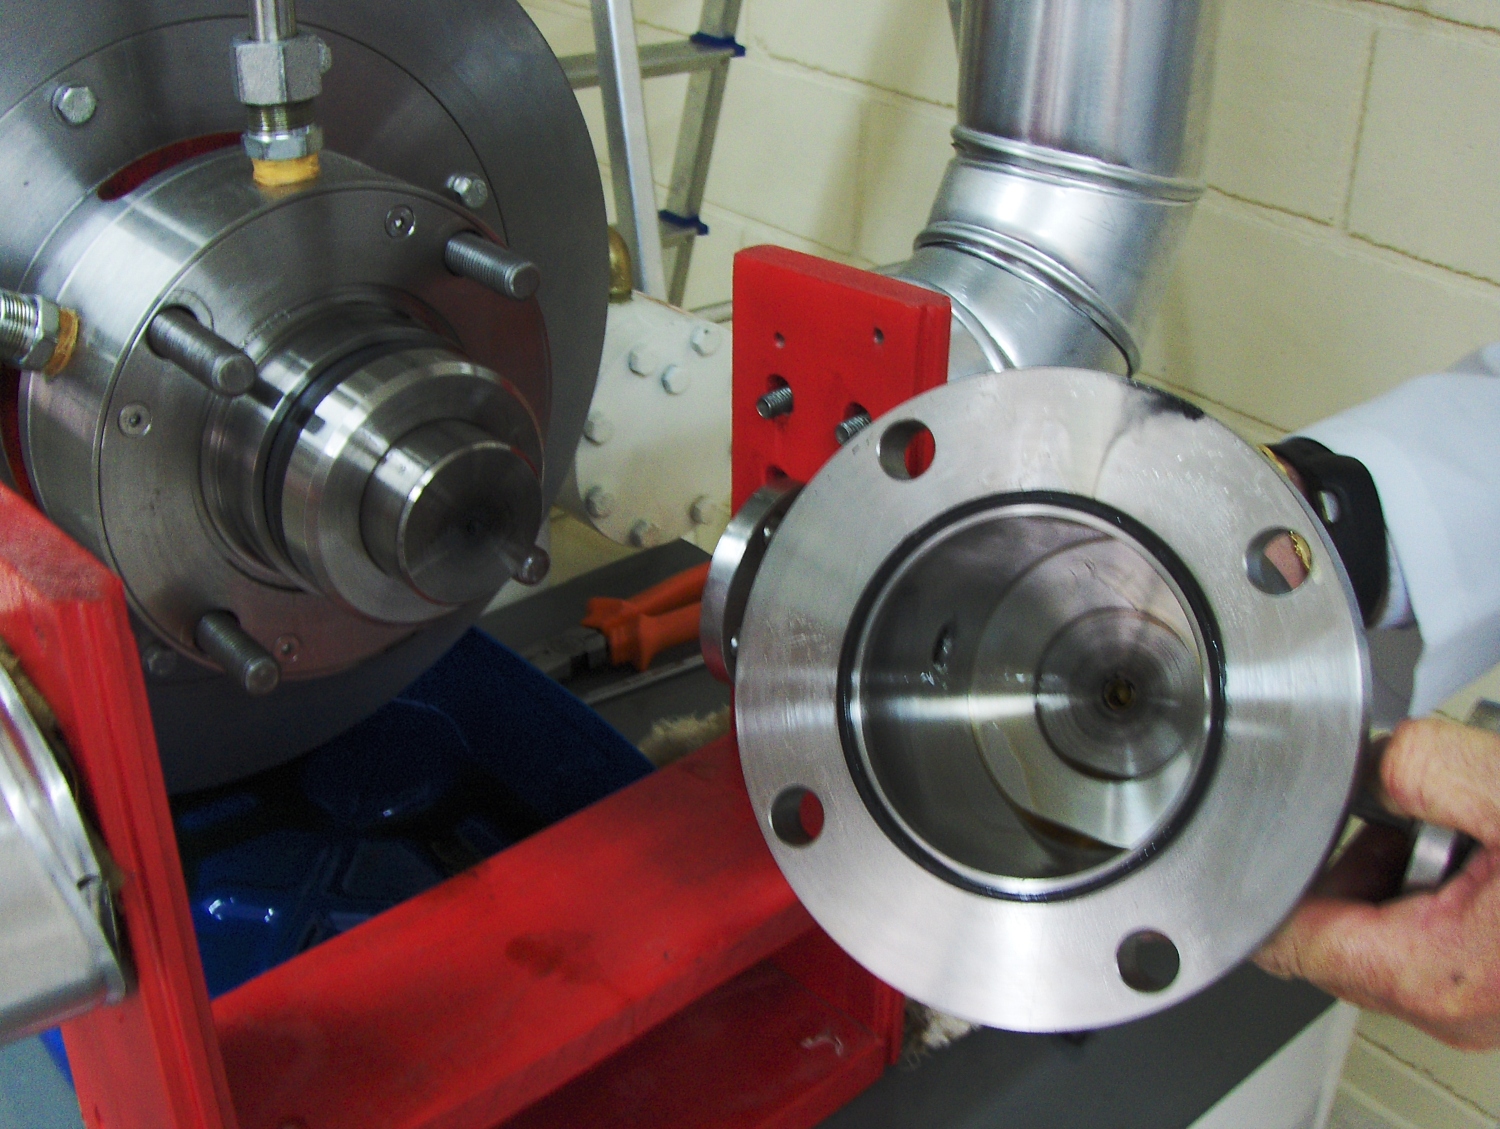
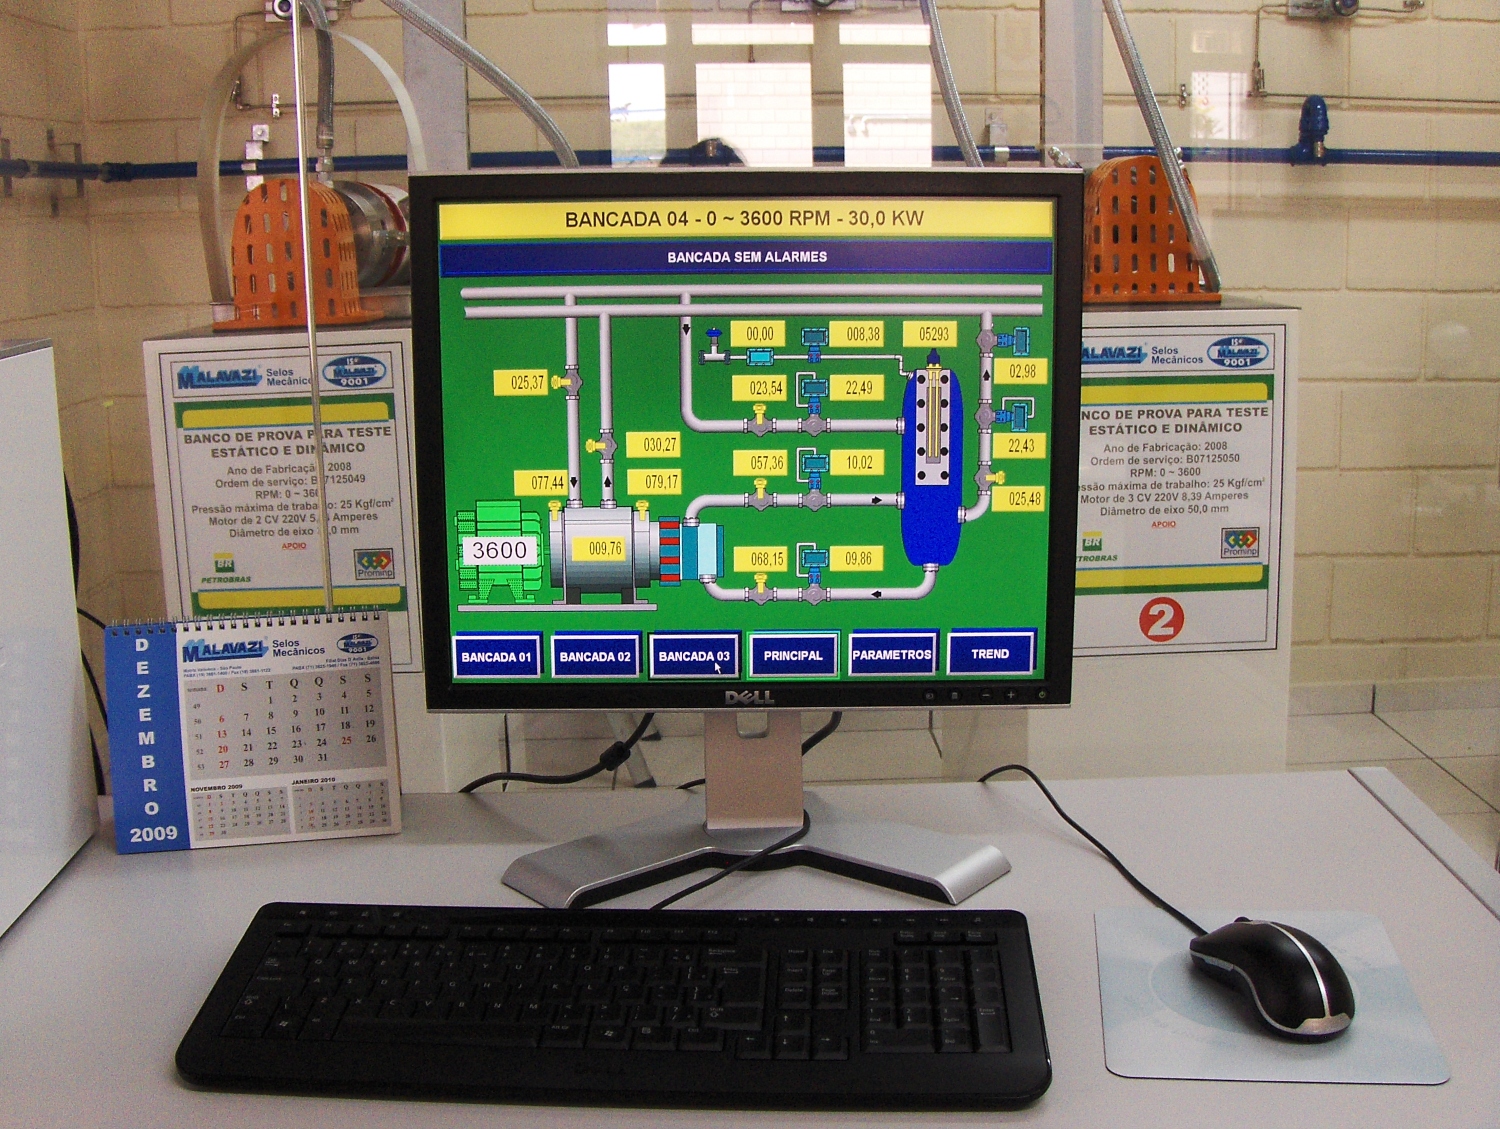
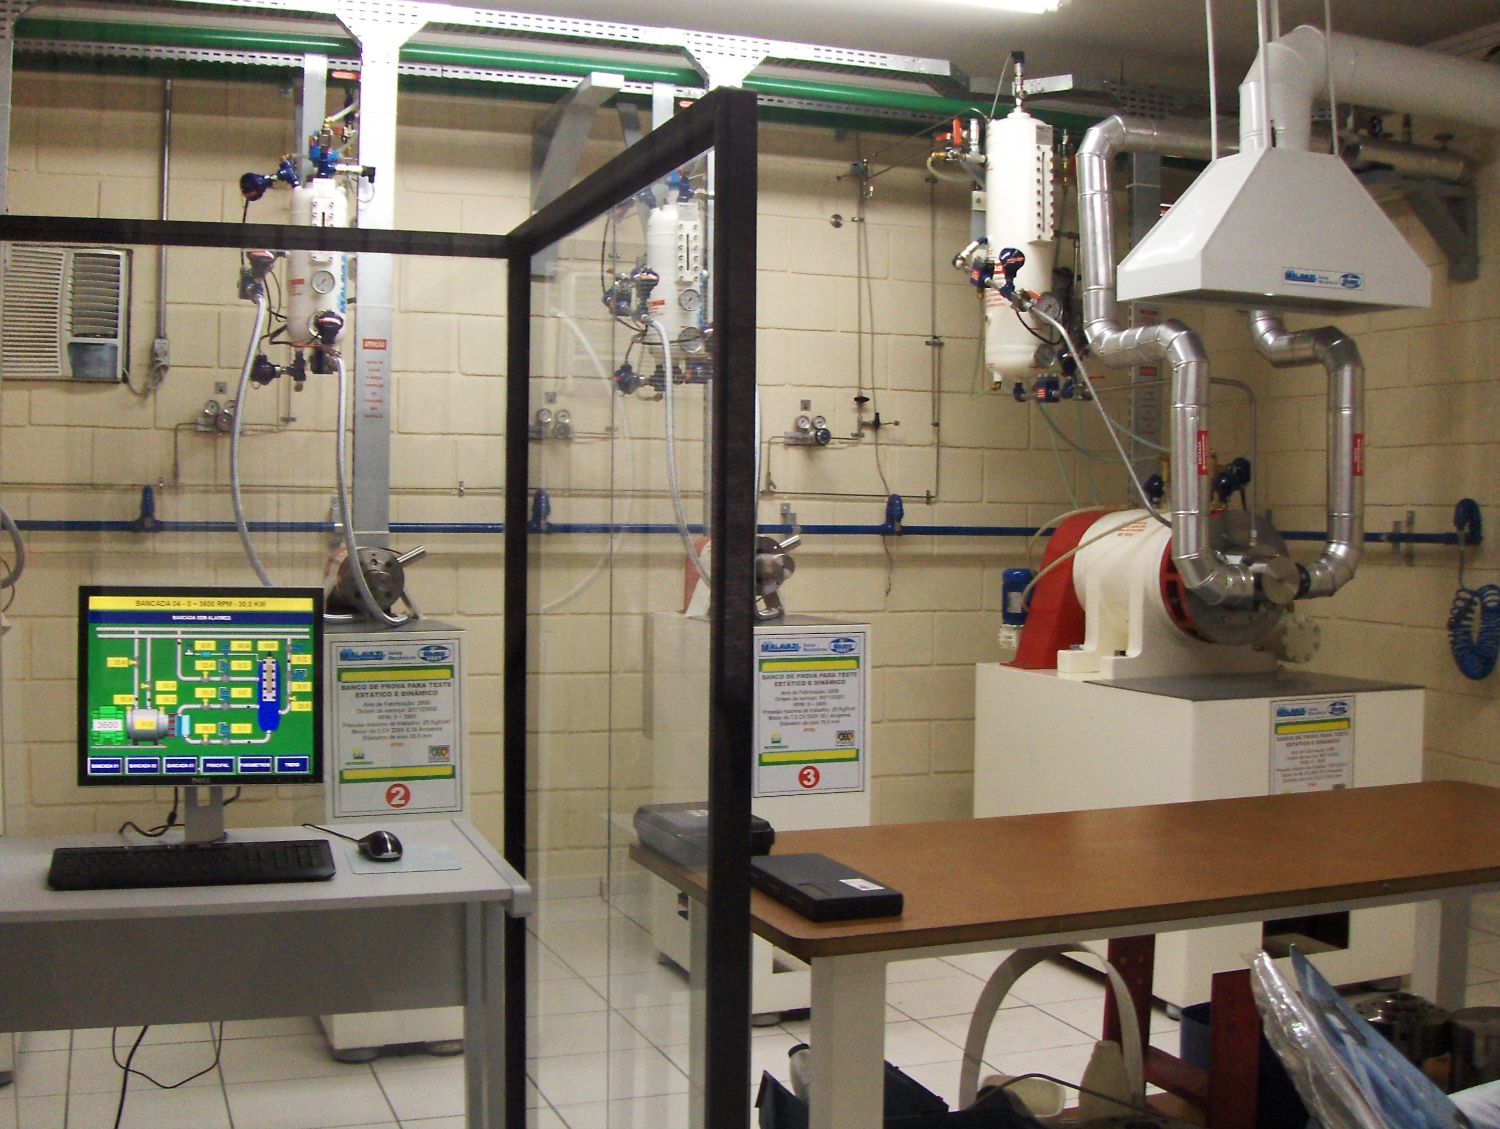
Malavazi operates its own laboratory, designed in accordance with international standards and equipped with test rigs that enable continuous monitoring of operating parameters and the generation of technical reports during testing.
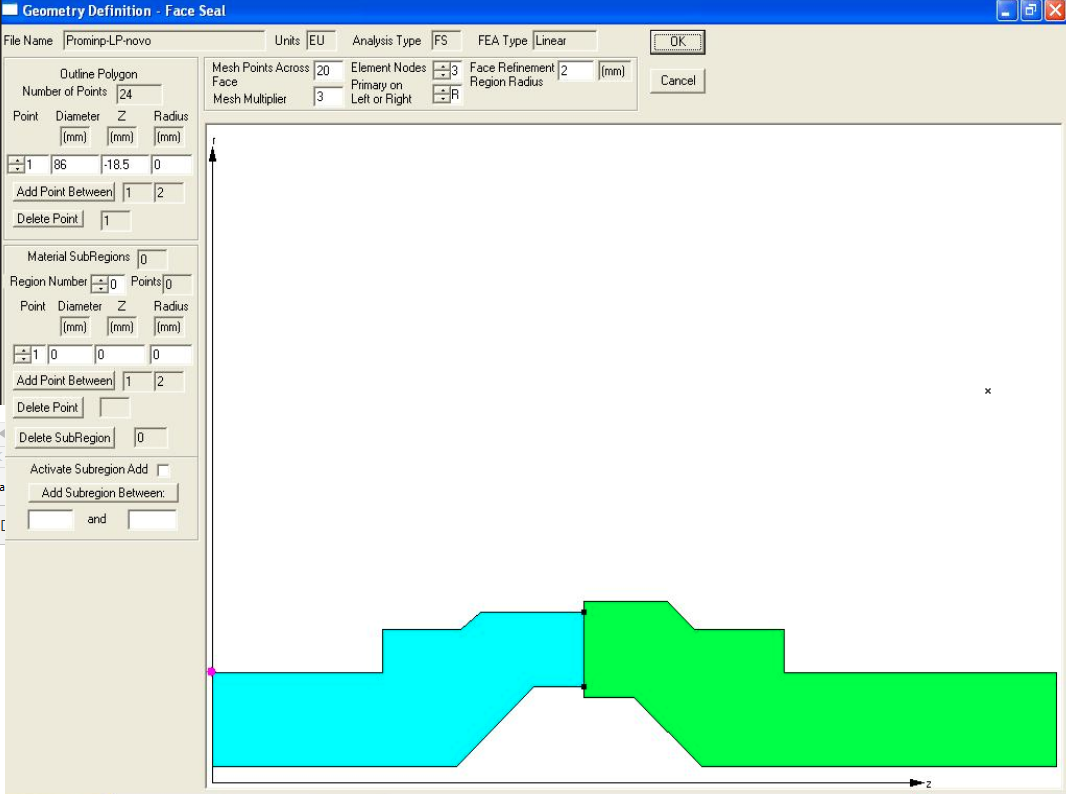
Finite element simulations were used to analyze the behavior of the API mechanical seal in operation, based on the geometric definition of the faces and the application conditions.
The results obtained allow the evaluation of the distribution of loads, temperatures, and pressures acting on the assembly, serving as the basis for the analyses presented below
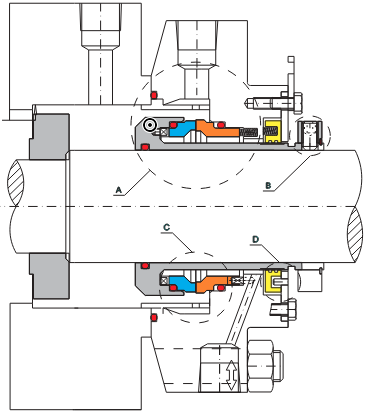
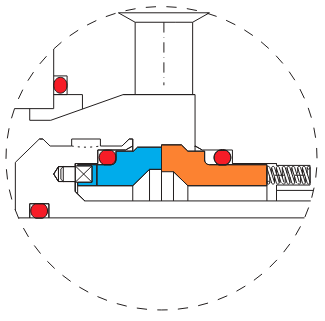
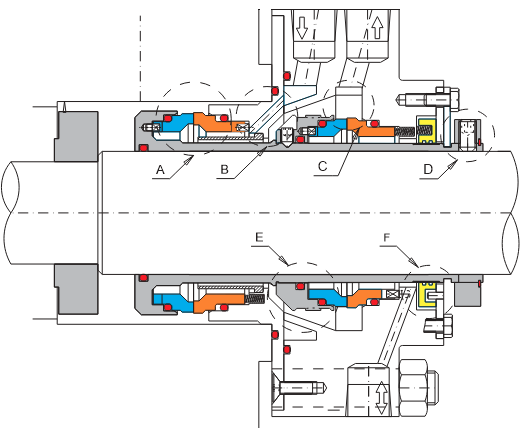
API 25 Mechanical Seal Line: Arrangement 1; Category 1; Type A

Image

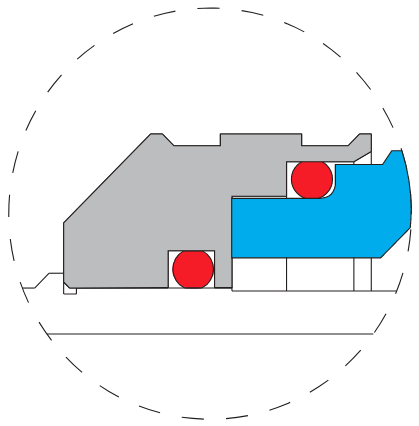
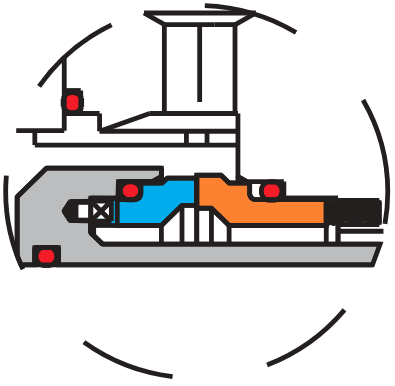
Detail "A"

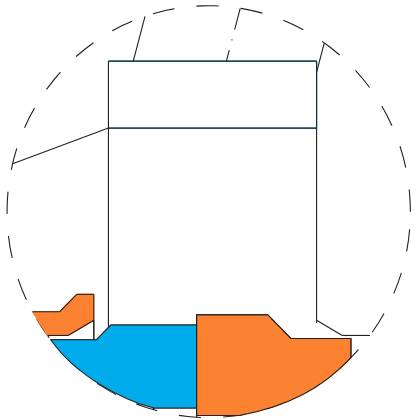
Multipoint system with greater clearance between components, providing improved flow distribution across the faces and reducing the risk of clogging.
 

Image

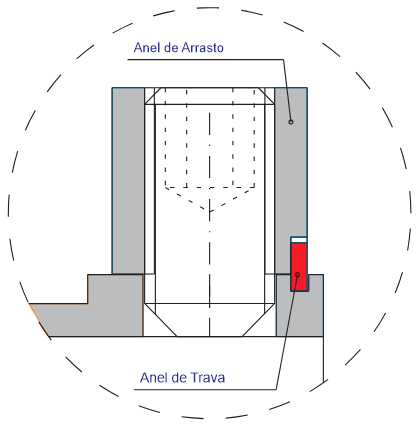
Detail "B"

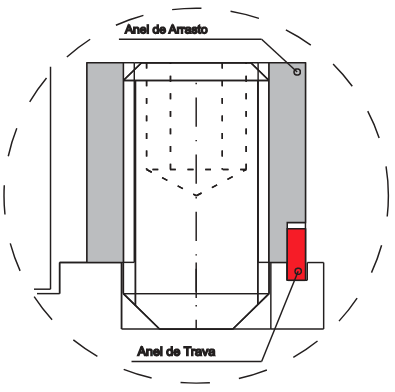
Drive ring assembled with the locking ring enclosed, with no possibility of displacement during operation due to centrifugal force.

Image

Detail "C"

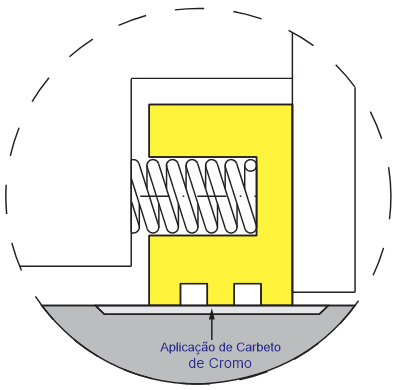
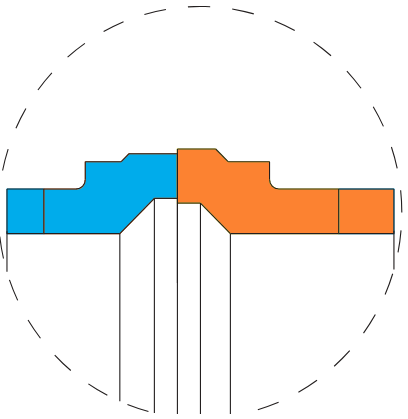
Differentiated faces, allowing greater radial displacement without loss of contact, preventing particle drag between the faces.

Image

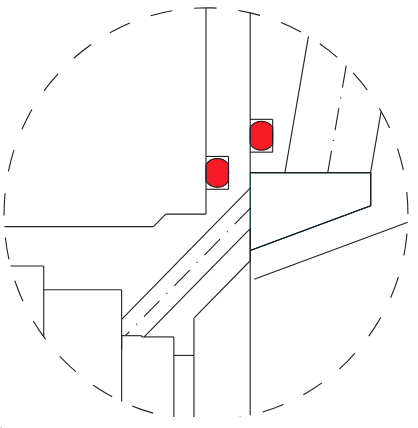
Detail "D"

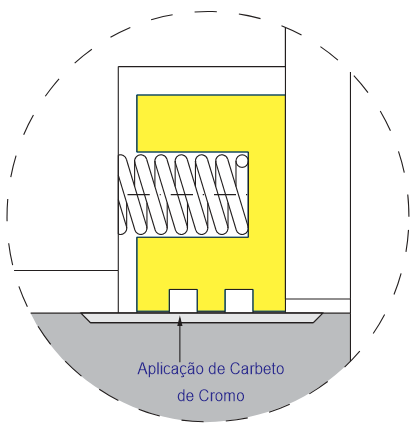
The anti-disaster floating ring features a travel of 1.5 mm above market standards. The quench outlet is dimensioned equivalent to an Ø 8 mm orifice, preventing centrifugation of micro-leakage in the front region of the overlay.

Image

Option Piping plan 13 and 23

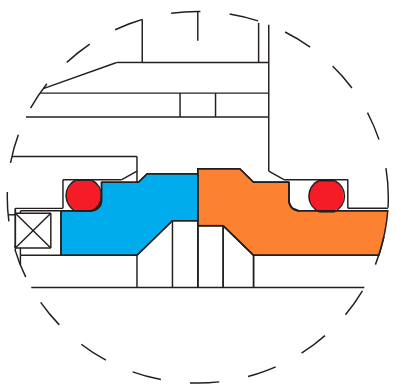
Pumping ring with special features, developed in the laboratory to promote increased circulation of the barrier fluid.


API 25 Mechanical Seal Line: Arrangement 2; Category 2; Type A

Image

Detail "D"

Drive Collar assembled with the locking ring enclosed without the possibility of coming out during work by centrifugal force.

Image

Detail "F"

The anti-disaster floating ring has a 1.5 mm ride above market standards, in addition to the output of the quench being proportional to a Ø 8 mm hole, preventing microleakage centrifugation on the front of the overlap.

Image

Detail "A"

Different seal faces, providing greater radial displacement.

Image

Detail "E"

Pumping ring with a special feature, developed in the laboratory to provide increased circulation of the barrier fluid, option for Plan 53.

Image

Detail "B"

Multipoint system, providing improved flow distribution across the faces.
Image

Detail "C"

Drive ring assembled with the locking ring enclosed, preventing displacement during operation due to centrifugal force.

FEA Software Calculations (Finite Element Analysis in Mechanical Seal Primary Seals)

Image

Input data

In this step, the geometry of the faces with their dimensions is inserted, where the simulation will be done, as well as other application information, such as: face materials, spring load, pressure distribution, temperature distribution, liquid distribution, rotation , types of liquids and other design data. After entering all the data, the software performs the calculations and generates all the results in the form of graphs and figures.

Image

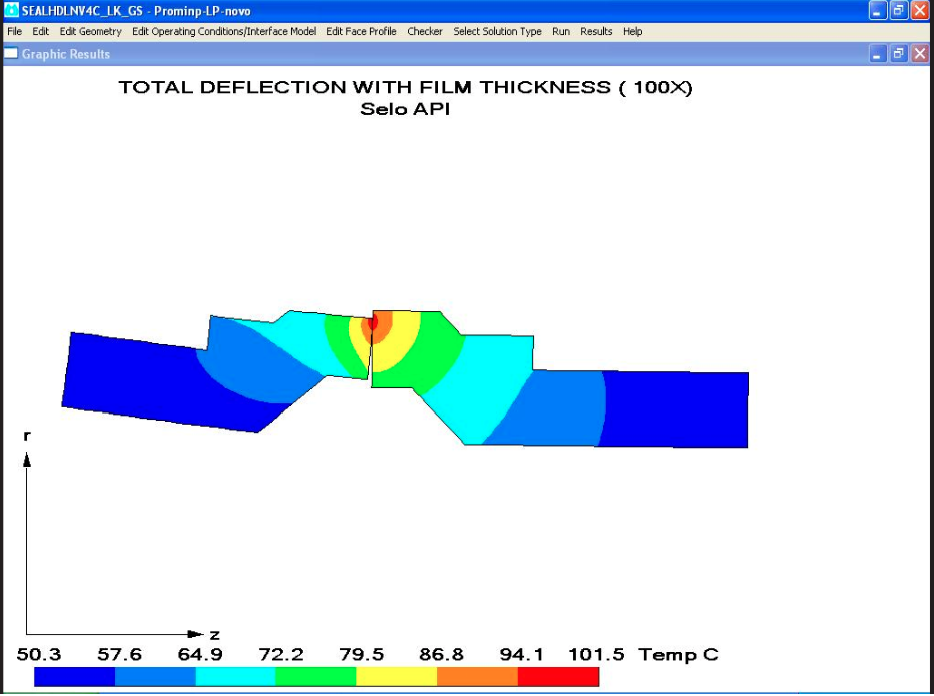
Full deflection

This total deflection graph presents the deformation of the primary seals under the application conditions. The temperature gradient indicates the temperatures reached by the seal faces and their influence on deflection.

For technical analysis purposes, the graph is shown with a 100× magnification, allowing the visualization of small-magnitude deflections.

Image

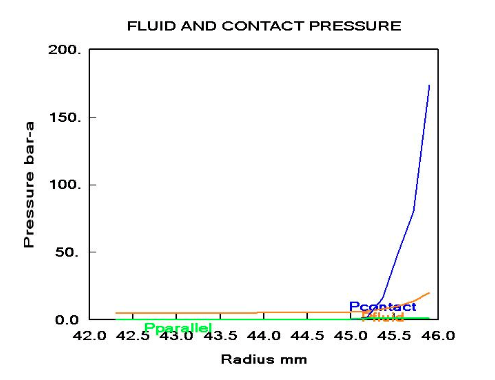
Contact pressure

This line graph presents the fluid action and contact at the seal faces. The radius analysis indicates load concentration in the outer region of the face, associated with a tendency toward wear.

Image

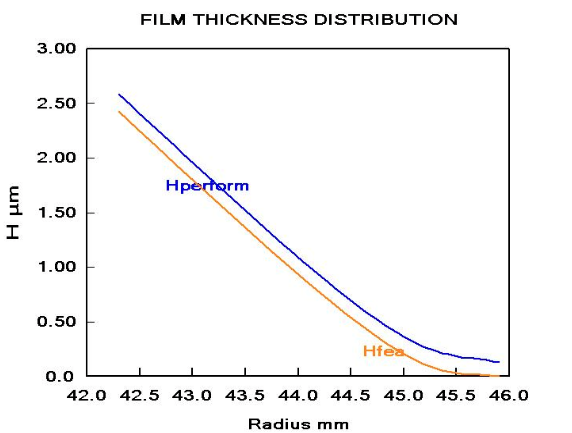
Lubricating film

This line graph presents the opening of the seal faces (GAP), in microns, required for lubrication of the contact faces. The analysis indicates that the minimum opening occurs at the larger radius, a region that also concentrates the highest contact pressure observed in the previous figure, maintaining a controlled micro-leakage.


Image

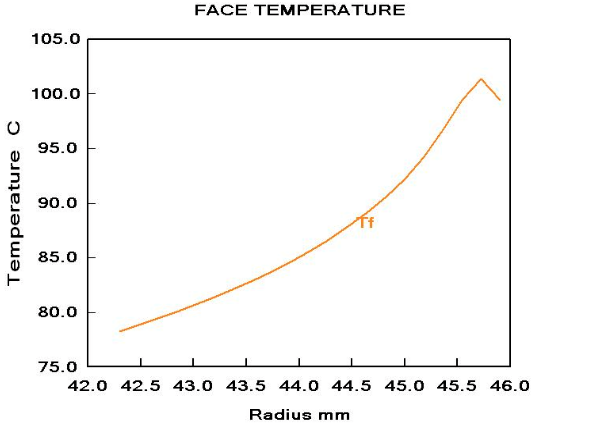
Temperature on the seal faces

This line graph presents the temperatures reached by the seal contact faces, which are higher in the same region of greater contact pressure.

Image

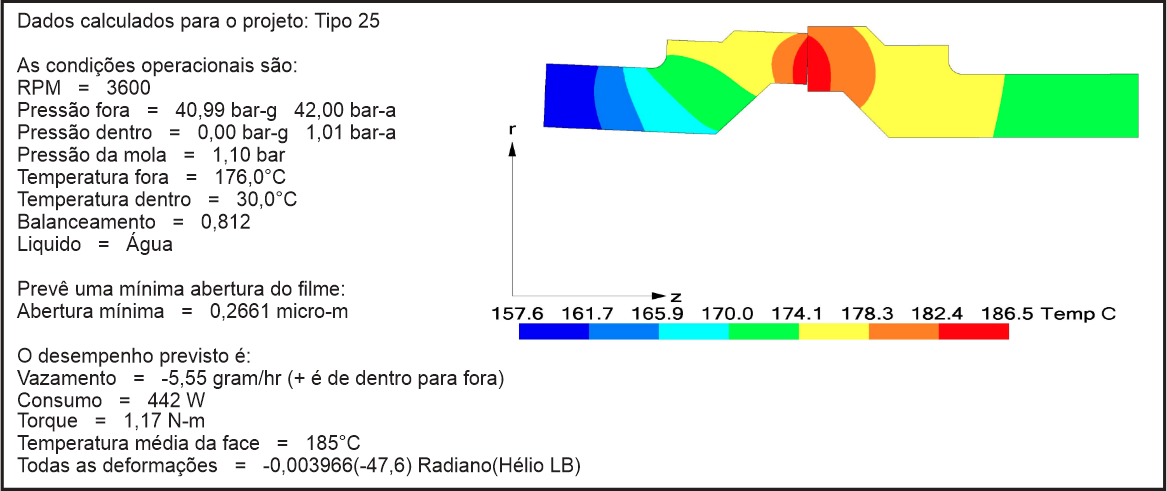
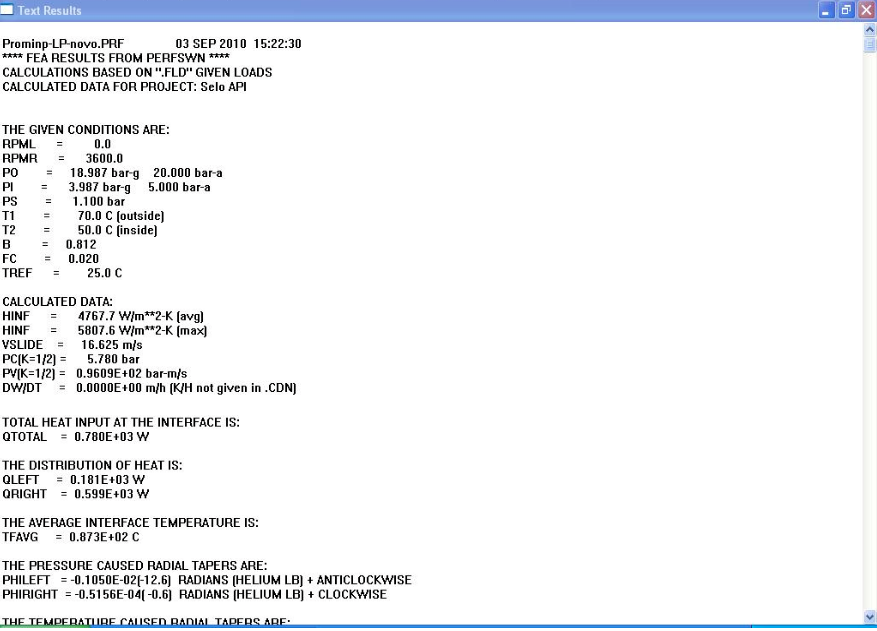
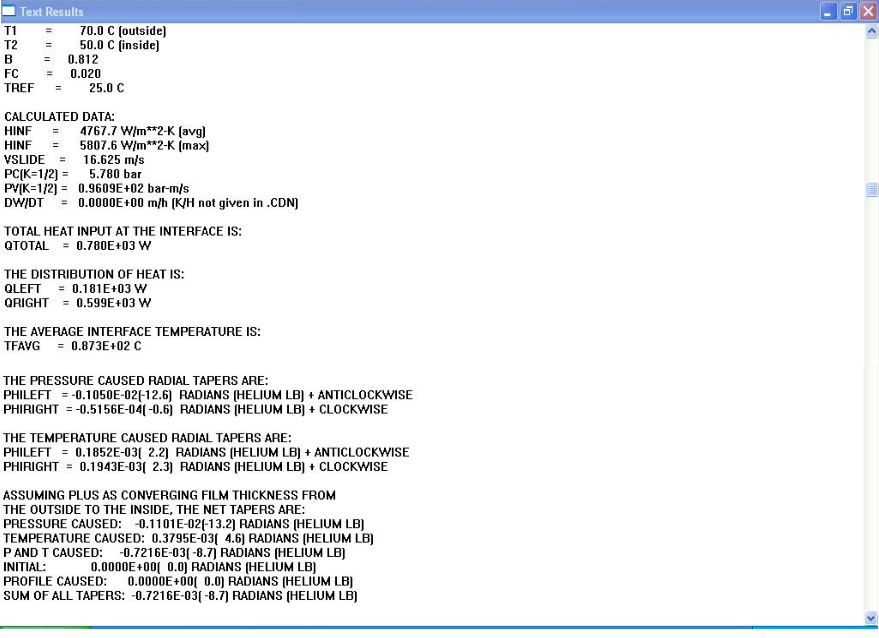
Calculation report

In addition to the graphs, the software also generates a report, as shown in the image. The document compiles the input data used in the simulation, as well as results such as sliding velocity and heat generation at the contact faces.

Image

Flatness in operation

In this demonstration, the deflections caused by pressure and temperature are presented, indicated by color bands, as well as the sum of these effects, resulting in the final deflection value of the faces.

Image

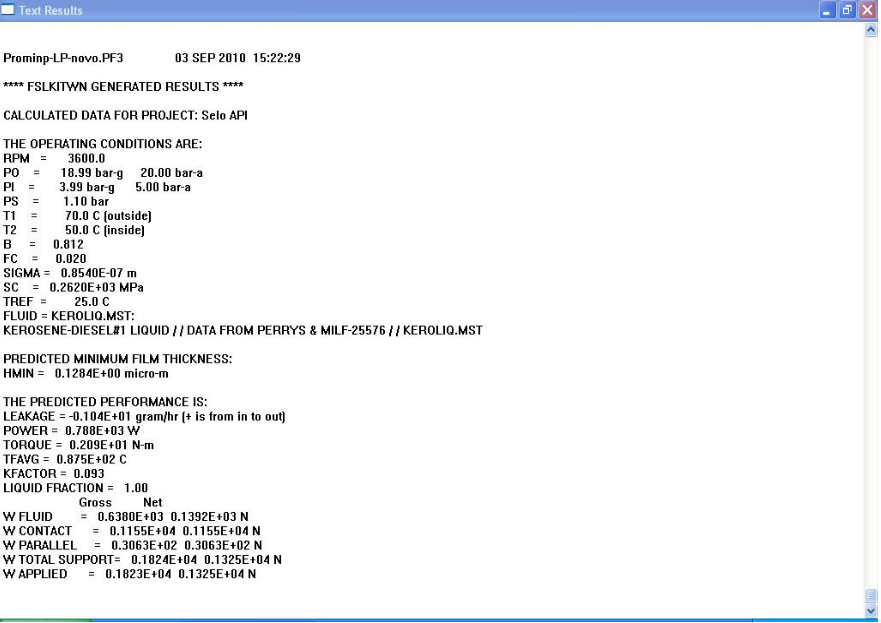
Final results

In this final section of the report, the main data resulting from the simulation are presented, including minimum seal opening, estimated leakage, energy consumption, required torque, average contact face temperature, liquid fraction at the contact face, and estimated contact pressure.

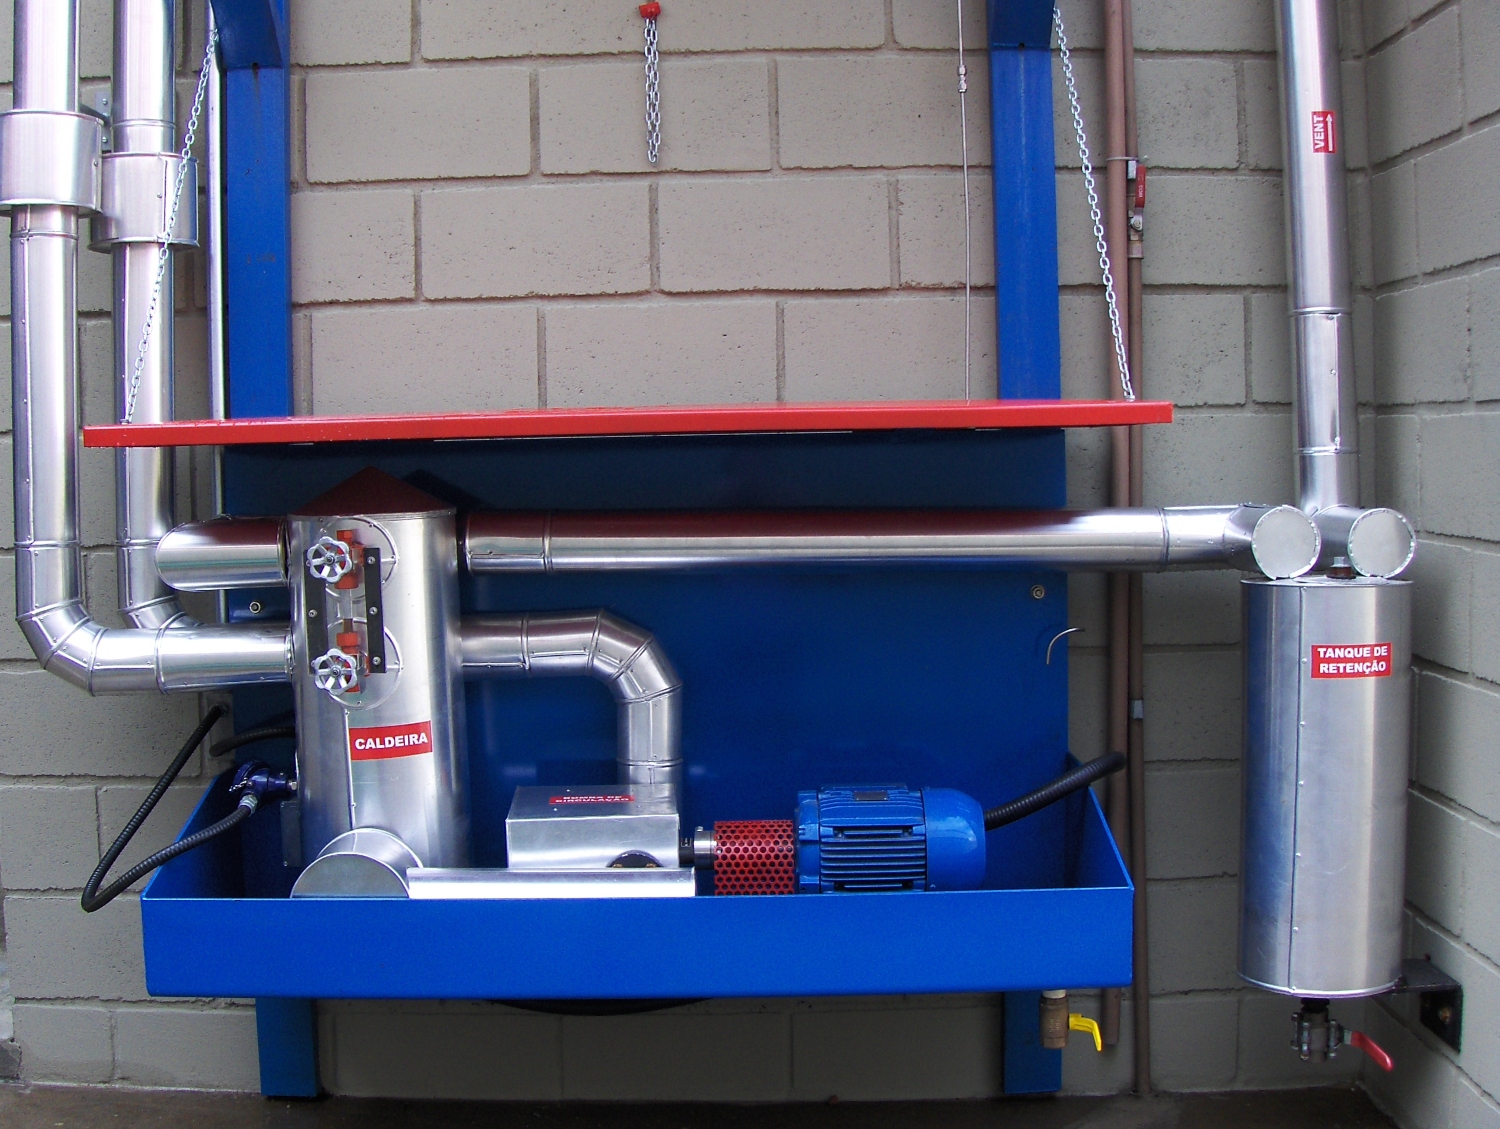
Preparation for API mechanical seal approval test

Image

Images

Image

Images

Image

Images

Image

Images

Image

Images

Image

Images

Image

Images

Image

Images

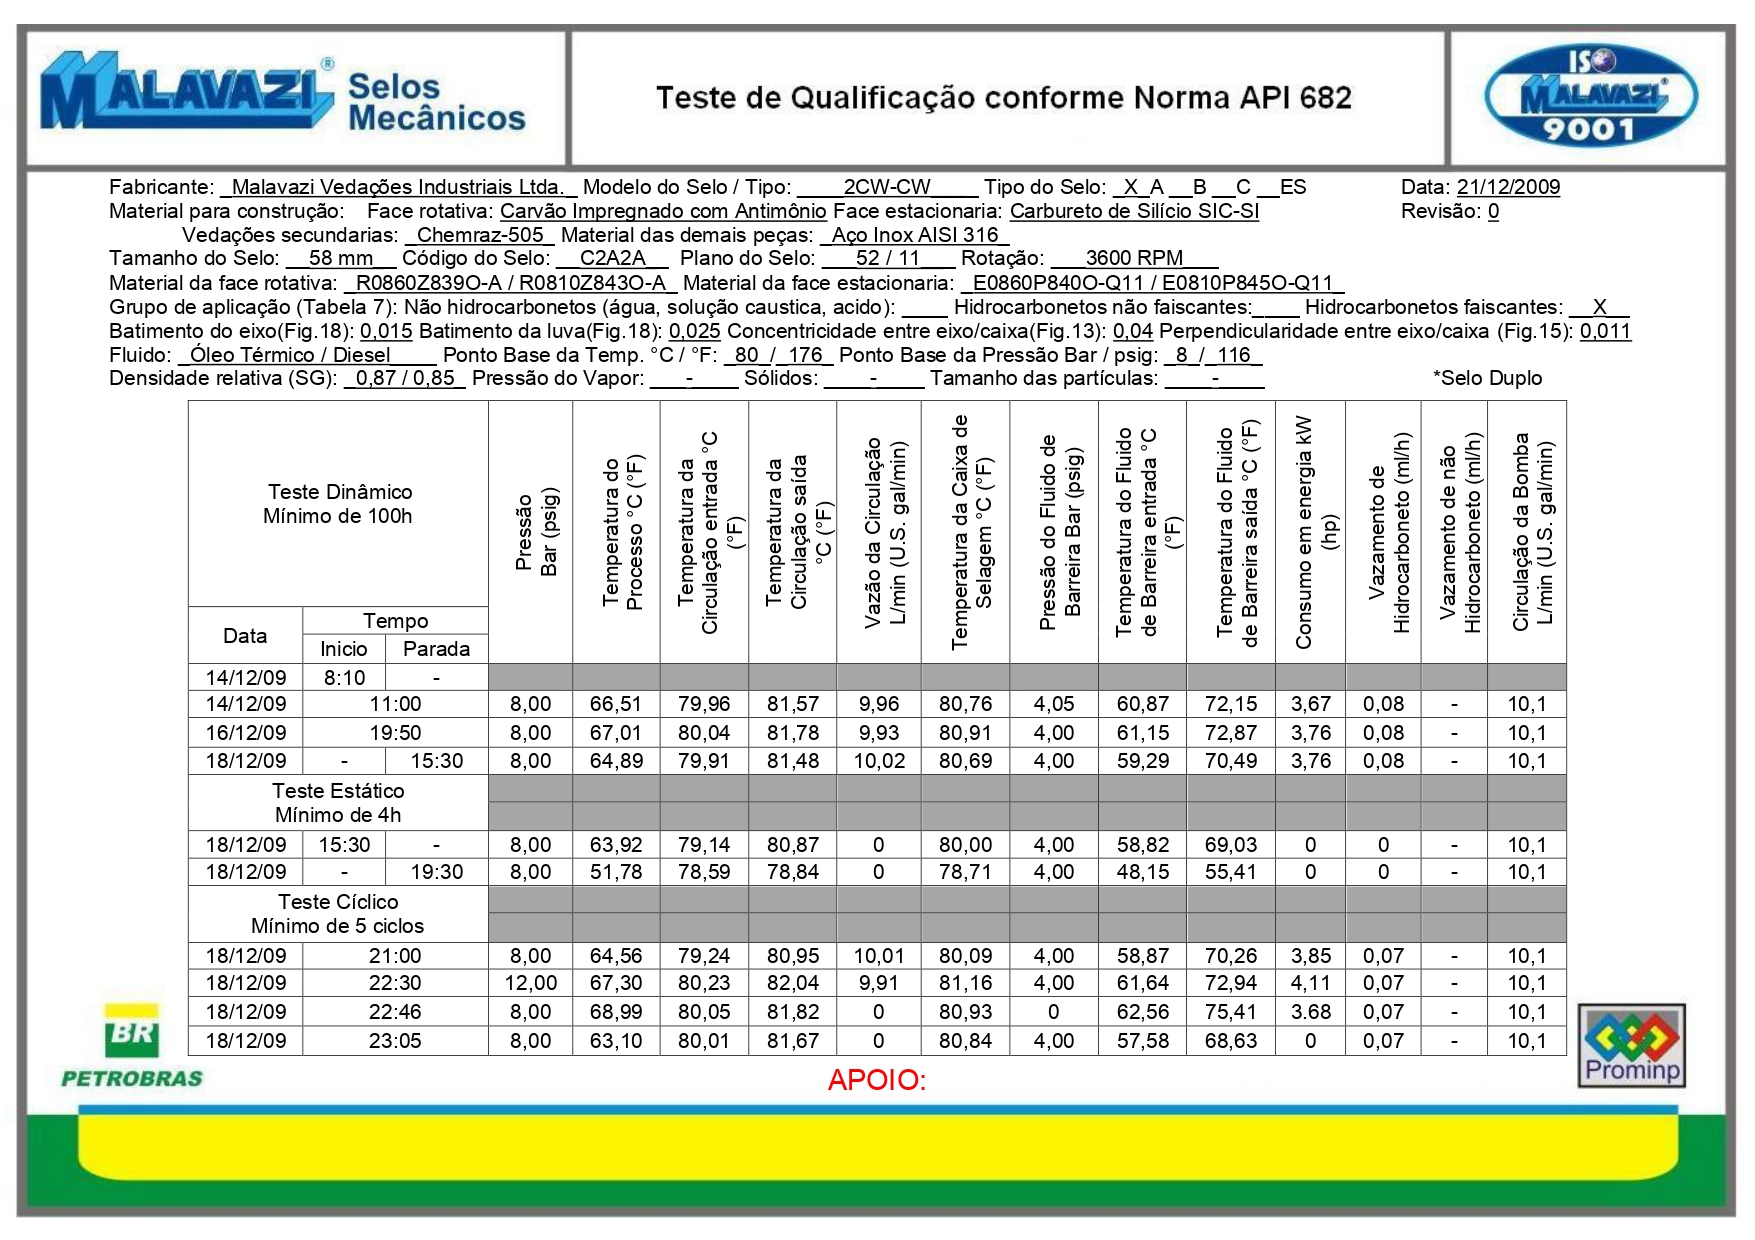
Results

Image

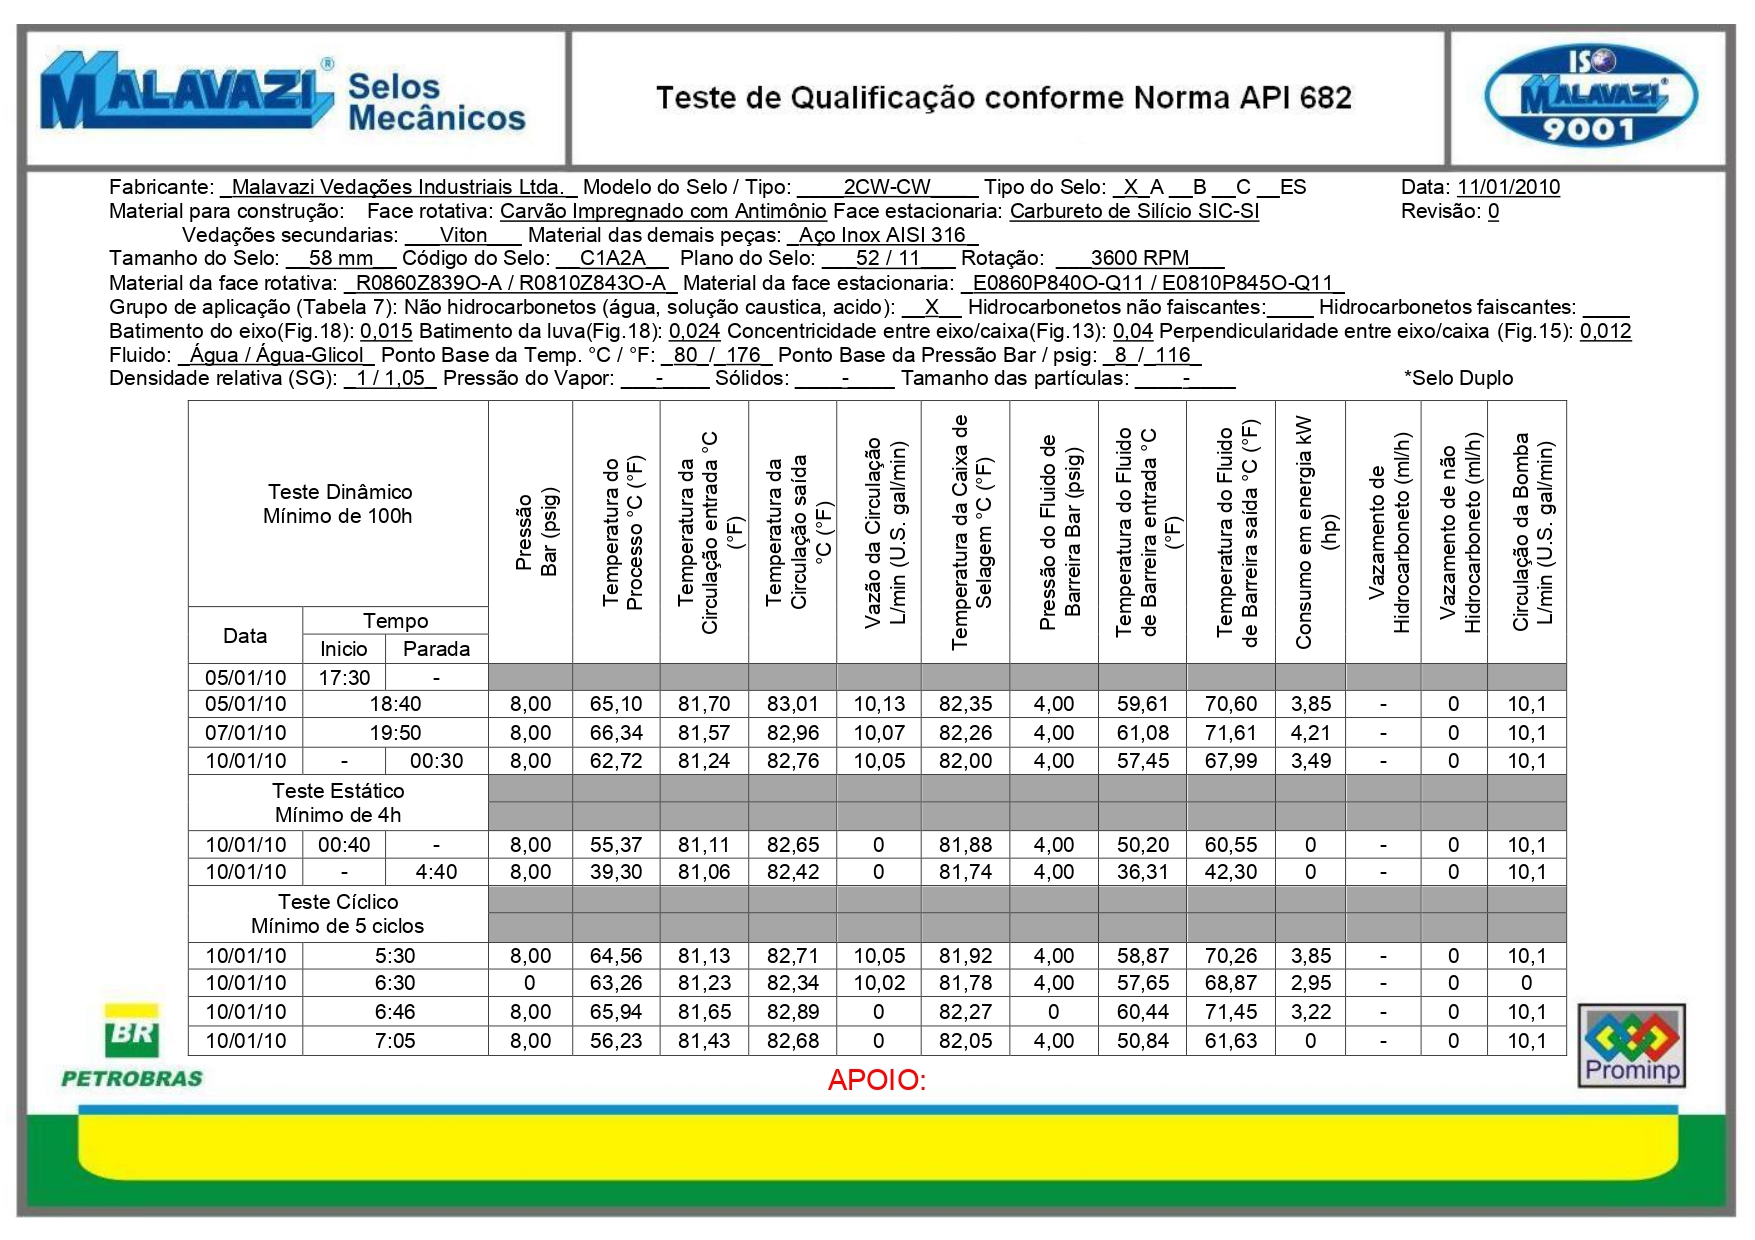
Results

Image

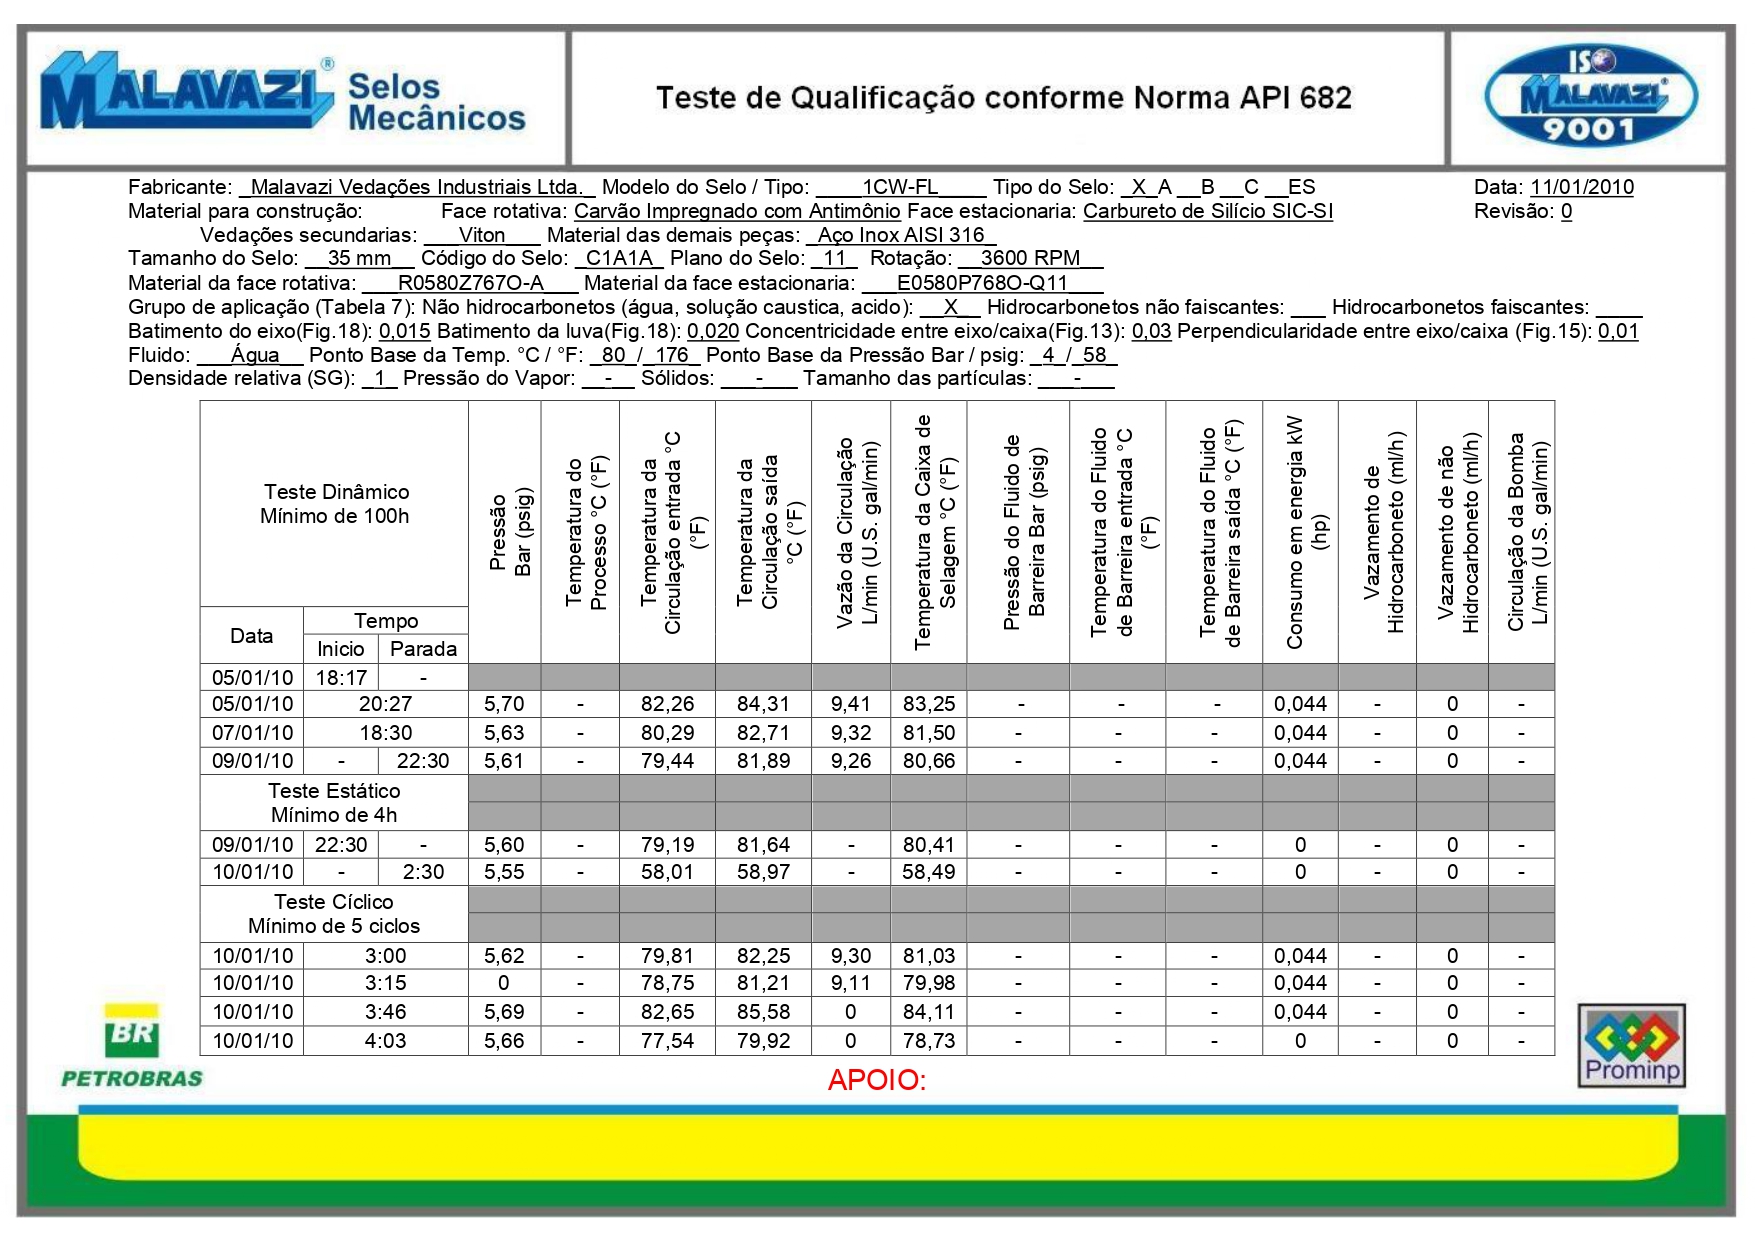
Results

Field tests

Image

Field tests

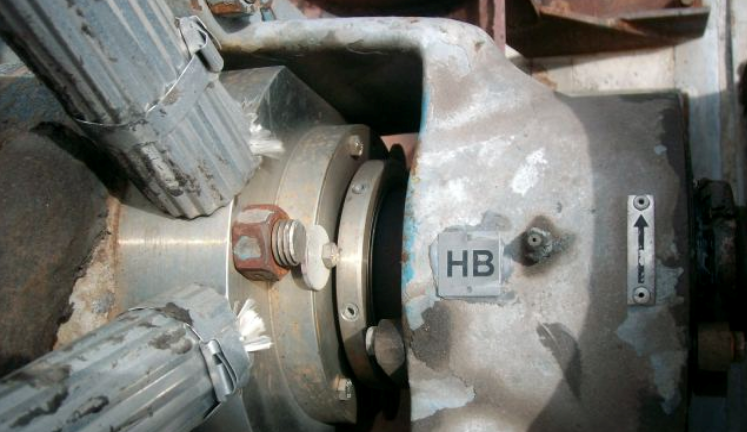
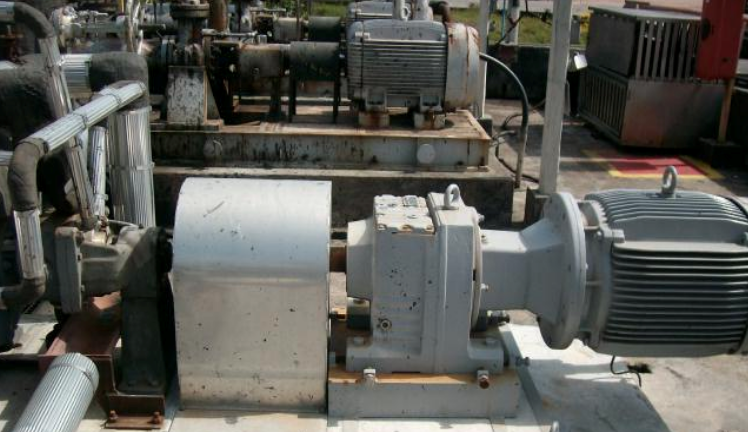
Installed at RPBC.

Image

Field tests

Installed at RPBC.

Image

Field tests

Installed at Repar.

Image

Field tests

Installed at Repar.